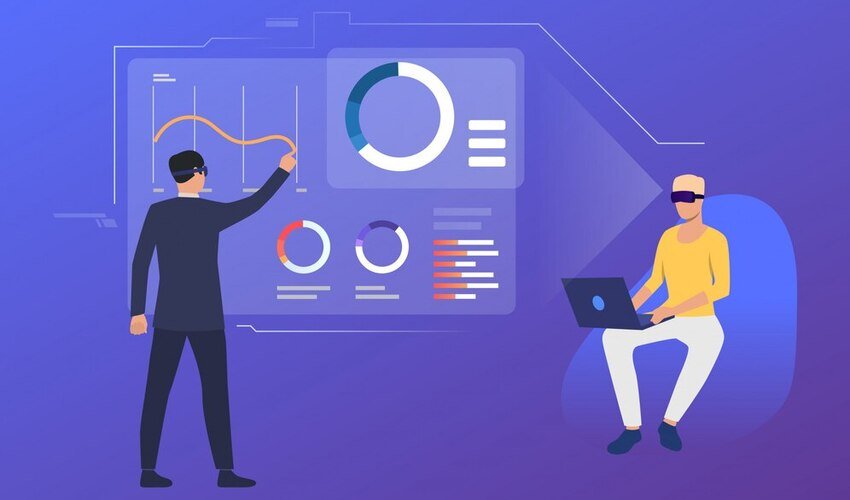
Category: Data Analytics & Visualizations

Spider Plot Explained: Visualizing Complex Data in a Simple Way

Spider Plot Explained: Visualizing Complex Data in a Simple Way

When you have lots of information, it can sometimes be hard to understand. Imagine trying to compare several things at once, like the performance of different students in various subjects or the features of different smartphones. A spider plot is a tool that helps us visualize and compare all that information in a simple and…
Read more

Selection Sort Time Complexity

Selection Sort Time Complexity: Big O Notation Breakdown

Selection Sort is a simple sorting algorithm. It works by finding the smallest element in the list. The smallest element is then swapped with the first unsorted element. This process repeats until the entire list is sorted. In this article, we will discuss the Selection Sort Time Complexity in detail. How Selection Sort Works Selection…
Read more

Exploring Time Complexities of Sorting Algorithm : Which is the Fastest?

Exploring Time Complexities of Sorting Algorithm : Which is the Fastest?

Sorting algorithms are a fundamental concept in computer science, playing a crucial role in data organization, searching, and optimization tasks. When dealing with large datasets, the efficiency of the algorithm becomes paramount. Here, we’ll dive into the time complexity of sorting algorithms to uncover which ones are the fastest and most efficient for different use…
Read more

Advantages of Data Visualization

5 Main Advantages of Data Visualization

Data Visualization is a graphical representation of data and information. By using visual rudiments similar to graphs, maps, and charts, data visualization tools can give an approachable way to prevision and understand trends and patterns in data. They help us to group and organize data grounded on orders and themes, making it easier to break…
Read more